Visualization Fusioncharts-suite-xt mySQL Query syntax format

kaito

Member
Hi everybody !!

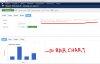
I am rookie at Fabrik, I have installed Fusioncharts following youtube video from Joomlashack (Thanks Robbie for your videos they help us a lot !!) and I have several mysql tables and I want make several sql queries to create graphs using Fusioncharts.

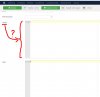
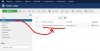
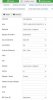
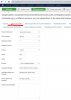
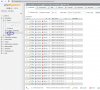
Any help about query sintax type in visualization-query frame (see screenshot attached) ? I mean, how can I place SQL sentences directly (I have tried but I have failed)? Just a few tips so I can deep further for myself

Thanks in advance for your help.

Ricardo
 

Attachments

  • visualization_query.JPG
    visualization_query.JPG
    58.2 KB · Views: 53
The tooltip says
Optional - you can override Fabrik's usual list query by providing your own, which returns a set of rows which include the fields you chose for value and label, aliased as their full element names, with additional _raw name, so mytable___myvalue and mytable___myvalue_raw
So I assume something like
SELECT a as mytable___myvalue, a as mytable___myvalue_raw, b as mytable___mylabel, b as mytable___mylabel_raw FROM mytable WHERE whatever

If you get it running please post your solution so the WIKI can be updated.
 
Hi troester,

Thanks for your fast reply. I have tried several SQL syntax, using/no using curly brackets, using/no using _raw.... but nothing has worked.
I made the mysql query in phpmyadmin:

SELECT eval_publico_n1.queda_claro_el_objetivo_, COUNT(*) FROM eval_publico_n1 GROUP BY eval_publico_n1.queda_claro_el_objetivo_

and it is correct it returns data I am interested to insert into chart (bar chart type) , see phpmyadmin.jpeg attached.

Then I have installed plotalot component (free) to check proccess with other joomla chart tool, I inserted same SQL sentence than above and works and I obtain same data results than in phpmyadmin (see plotalot1.jpg attached) and the bar type chart that I want (see plotalot2.jpg attached).

So, I do not know what I am doing wrong into the Query frame of Fabrik Visualization and I would like to work with Fusioncharts instead with Plotalot.

Can anyone point out something about this SQL Query Syntax in Visualization?

Thanks in advance

Ricardo
 

Attachments

  • phpmyadmin.JPG
    phpmyadmin.JPG
    141.8 KB · Views: 57
  • plotalot1.JPG
    plotalot1.JPG
    125.1 KB · Views: 55
  • plotalot2.JPG
    plotalot2.JPG
    117.4 KB · Views: 53
Ok, I tested myself, it's working fine.

You must have a Fabrik list pointing to your database table.
I'm not sure if you can use column names ending with _ in Fabrik.

Set Connection, List, Element, Label in the viz settings.

"Element" can be any of your elements beside the "Label" element because you want to override the selected data in the query.
So assuming "id" is selected as "Element"
Query:

SELECT
n1.queda_claro_el_objetivo_ as eval_publico_n1___queda_claro_el_objetivo_,
n1.queda_claro_el_objetivo_ as eval_publico_n1___queda_claro_el_objetivo__raw,
count(*) as eval_publico_n1___id,
count(*) as eval_publico_n1___id_raw,
FROM eval_publico_n1 as n1
GROUP BY n1.queda_claro_el_objetivo_

As I said, I don't know if queda_claro_el_objetivo_ will break anything
 
Thanks again troester for your help !!!

I have followed your indications and there is a message "there is no data to display" instead the desired bar chart (see no_data_to_display.jpg attached).

This is what I have checked:

- Fabrik list pointing to your database table. OK, name of my list: TEST: HABLAR EN PÚBLICO Nivel 1 pointing to eval_publico_n1 tabledata (see list.jpeg attached)
- Column name "queda_claro_el_objetivo_" ending in "_" . OK, I have delete last underscore symbol and now column name is "queda_claro_el_objetivo" (see database.jpg attached)
- Connection to database. TESTED OK (see connection_test_ok.jpg attached)
- viz settings: see viz_settings1.jpg and viz_settings2.jpg attached

Just to make clearer my objective of the SQL query, in database "eval_publico_n1" is to count inside "queda_claro_el_objetivo" column how many "1" are (result=1), how many "2" are (result=4), how many "3" are (result=1) and finally how many "4" are (result=2).

So if query is working for you, maybe there is something wrong in the query syntax . Please, I would appreciate your help again to find the error.

Thanks again !!
 

Attachments

  • list.jpg
    list.jpg
    56.9 KB · Views: 55
  • database.JPG
    database.JPG
    212.9 KB · Views: 56
  • connection_test_ok.JPG
    connection_test_ok.JPG
    90.6 KB · Views: 54
  • viz_settings1.JPG
    viz_settings1.JPG
    49.2 KB · Views: 53
  • viz_settings2.JPG
    viz_settings2.JPG
    80.2 KB · Views: 59
  • no_data_to_display.JPG
    no_data_to_display.JPG
    21.7 KB · Views: 58
The "Elemento" element should not be the same as the "Etiqueta" element.
If you take my example query the "Elemento" must be the id element.

You don't show the query. Make sure you have 3 _ after the table name and 1 _ before raw (now after you have deleted the trailing _ of the column)
 
Hi troester,

Following your indications I have achieved to create the graphs but there are some points I don´t understand. Just to be easier to explain than previous example (names too large) , I have prepared a new list, named poll, about reliabiliy (low, medium,high and superb) for 3 cars maker (Toyota, Audi and Renault):

- "car" is a dropdown element with values =1,2,3 and Labels=Toyota,Audi,Renault; so value 1 correspond to label Toyota, and so on.
- "reliability" is a radiobutton element with values=1,2,3,4 and Labels=low,medium,high,superb; so value 1 correspond to low, and so on

I have entered data to list, simulating that 8 persons have voted each car´s reliability, so there are 24 records in the list (see list_with_labels.jpg attached) and thus the database (see database_with_values.jpg attached).

The goal is to obtain a graph like showed in graph_goal.jpg (I made it as example using excel), where we can see how many persons voted what reliability level had each car maker.

I have configured visualization using Fusion-charts-xt + MultiSeries Column 2D and the configuration is showed in visualization_configuration.jpg. Data for graph is obtained adding this query 3 times (using add button) , changing in every query only WHERE poll.car= 2 and WHERE poll.car=3:
SELECT poll.reliability AS poll___reliability,
COUNT(*) AS poll___id_raw
FROM poll
WHERE poll.car=1
GROUP BY poll.reliability

There is a menu item that points to this visualization and when clicked, graph is showed (see graph_obtained.jpg.

1st question: column data corresponding to car=1 (Toyota) is not showed in the graph, I have manually marked in the graph with blue X where toyota´s data should be placed.

2nd question: if dropdown and radiobutton elements have values (stored in database) and labels (showed in the list) how can I recover labels from query?

3rd question: is it possible to use placeholders inside query to make?

I would appreciate your help.

Thanks,

Ricardo
 

Attachments

  • list_with_labels.JPG
    list_with_labels.JPG
    70.4 KB · Views: 51
  • database_with_values.JPG
    database_with_values.JPG
    157.6 KB · Views: 51
  • graph_goal.JPG
    graph_goal.JPG
    26.9 KB · Views: 57
  • visualization_configuration.JPG
    visualization_configuration.JPG
    72.6 KB · Views: 57
  • graph_obtained.JPG
    graph_obtained.JPG
    40.7 KB · Views: 55
column data corresponding to car=1 (Toyota) is not showed in the graph,
No idea, maybe it's just displayed as a white stack?
if dropdown and radiobutton elements have values (stored in database) and labels (showed in the list) how can I recover labels from query?
Better use look-up tables and database joins, then you can get the labels via join/subquery. For dropdown and radiobuttons the labels are stored in the Fabrik element parameters where you don't have direct access.

I don't use Fusioncharts, I only tested a bit with a "technical" view to see if/how the query is doing, I really don't know details of setting up Fusioncharts attributes etc.
 
Thanks troester for your tips.
About first column not displayed, it s not white. If I only select data from Toyota, then the toyota´s column is displayed, but if I select 2 or 3 car´s dataset then it is not displayed.
can anyone give me reply to the 3 questions (or any)?
Thanks
 
We are in need of some funding.
More details.

Thank you.

Members online

Back
Top