
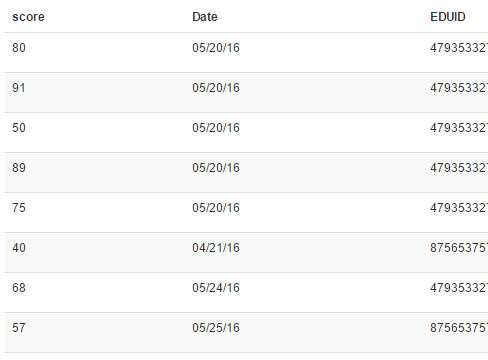
I have a table with test scores, it has the test score, userid, and the date the test was taken, I have it working and showing the table in my list view like I need it using a calc element and puting in the calulation field:
but I have multiple records in the table that relate to multiple userids that have taken a test or have a test record, Potentially there could be thousands of test scores connected to hundreds of users, during setup (pre production), I have 8 test scores in the table which relate to 3 users, with their userid.
I need to somehow filter the scores to relate to the userid (EDUID). The list view is filtered with a record for each user, and the row shows the graph but it shows all the scores for all users, I need to filter the score based on the row or the user in the row.
The list view looks like this
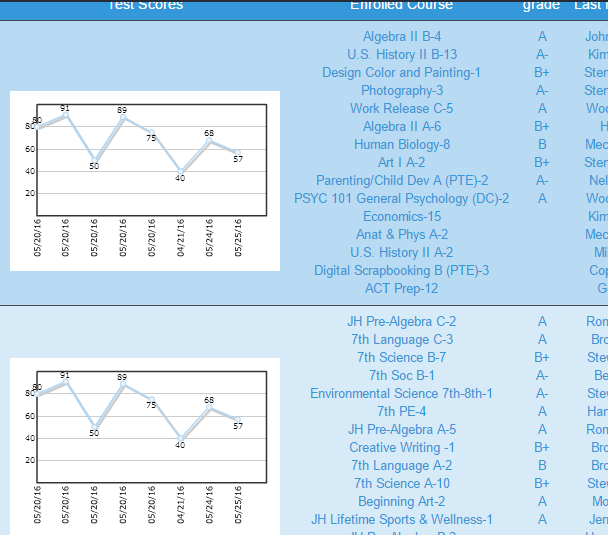
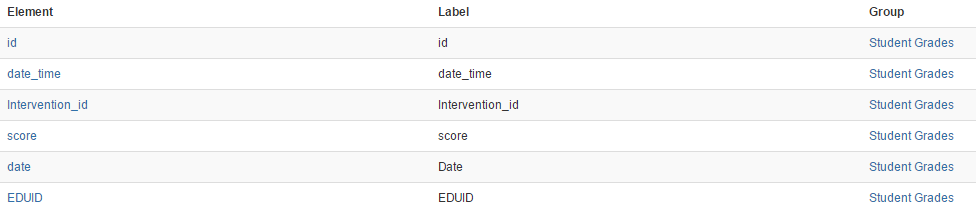
The scores chart is related to the students table and an interventions which is not really relevant to showing the chart. But the chart is showing all the scores regardless of the EDUID with I am trying to filter to only show the scores related to the user.Here is the element view for the scores table:
I have tried to filter the charts based on the where in the visualization options but, I don't have the syntax right and it errors out and I have also tried to add the filter on the URL
But I am missing something, and I am not sure how to filter this to show in the chart only the scores related to the student in the row.
Thanks.
Code:
return '{fabrik view=visualization id=10}';I need to somehow filter the scores to relate to the userid (EDUID). The list view is filtered with a record for each user, and the row shows the graph but it shows all the scores for all users, I need to filter the score based on the row or the user in the row.
The list view looks like this
The scores chart is related to the students table and an interventions which is not really relevant to showing the chart. But the chart is showing all the scores regardless of the EDUID with I am trying to filter to only show the scores related to the user.Here is the element view for the scores table:
I have tried to filter the charts based on the where in the visualization options but, I don't have the syntax right and it errors out and I have also tried to add the filter on the URL
Code:
return '{fabrik view=visualization id=10&rowid=EDUID}';Thanks.
Last edited: